// FINANCE
FINANCE
[MINOR]// PROJECTS
FEATURED
Financial Calculator
01 / 03
// ALL_WORK
01 / PROJECT
Financial Calculator
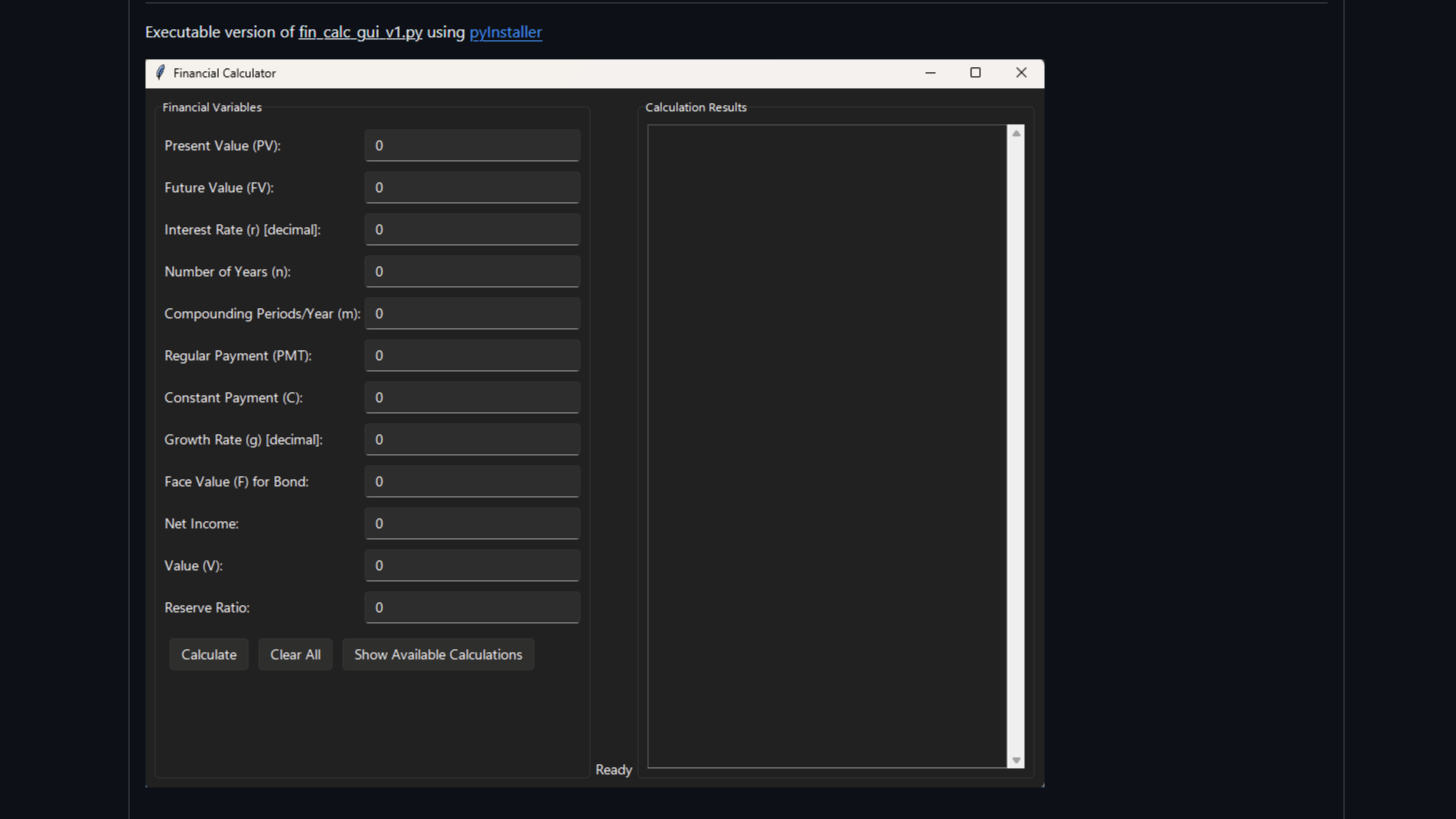
Desktop GUI financial calculator built with Python and tkinter for a finance fundamentals course, covering 19 time-value-of-money and fixed-income calculations.
// FEATURES
- →Simple and compound interest: FV, PV, effective rate, unknown rate, unknown time period
- →Multiple and continuous compounding with configurable periods per year
- →Ordinary annuity and annuity due, both FV and PV
- →Bond pricing using coupon payments and face value discounting
- →Constant and growing perpetuity present value
- →Capitalisation rate and value, and credit multiplier
- →Sun Valley themed GUI with per-calculation input forms
- →Packaged as a standalone .exe via GitHub Releases
// CHALLENGES
Covering the full breadth of a finance course in one cohesive tool
Modular calculation functions mapped to tabbed/sectioned UI panels, each with its own labelled inputs
Distributing a Python GUI app without requiring a Python install
Compiled to a standalone executable and published as a GitHub Release
02 / PROJECT
Portfolio Construction Case Study
10-week investment portfolio built for a climate-conscious NZ client, covering equity valuation, fixed income, derivatives, and portfolio optimisation across NZX-listed assets.
// FEATURES
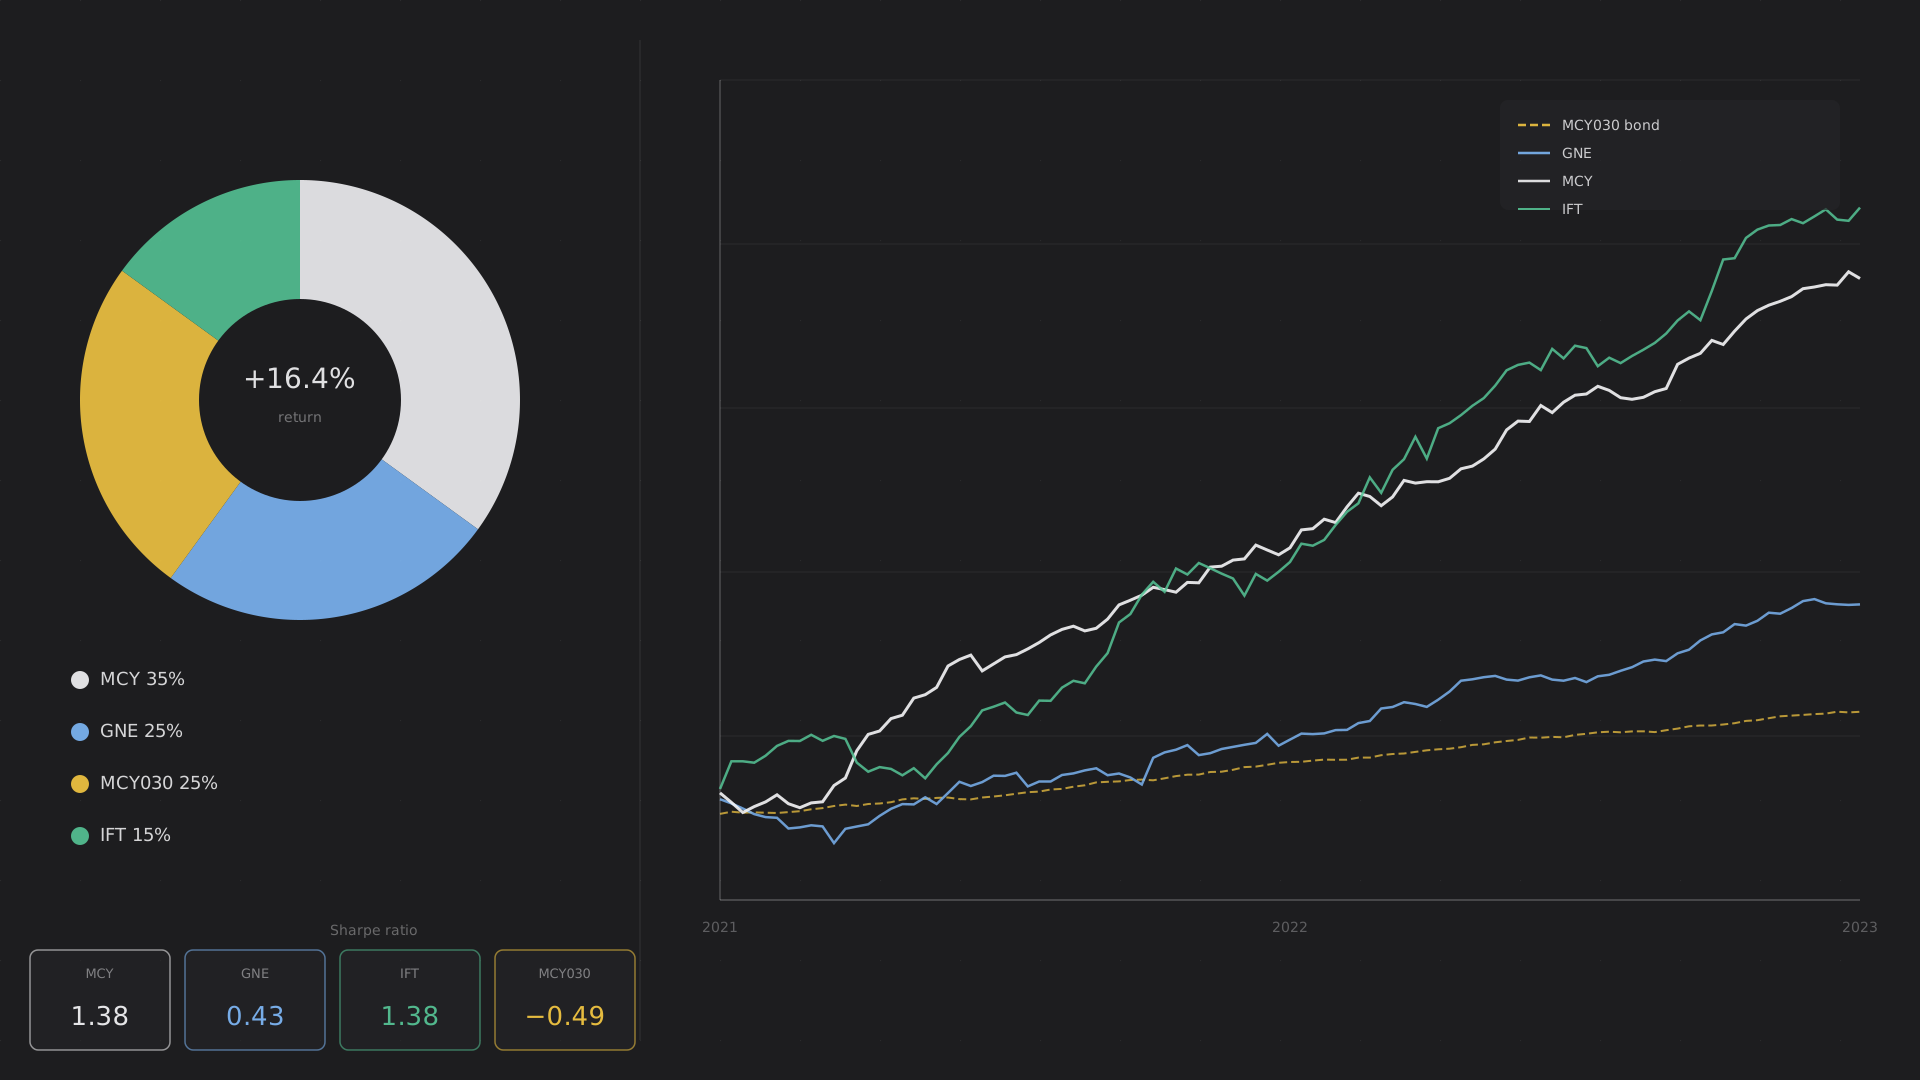
- →Client profile: 30–40 year horizon, ethical NZ-focused mandate, 7–9% return target
- →Equity analysis of MCY and GNE using CAPM, DDM, P/E, and dividend yield
- →Green bond (MCY030) priced via YTM approximation and yield curve forward rate derivation
- →NZX50 short futures hedge modelled against GNE long position
- →Efficient frontier constructed across three assets with correlation matrix
- →Infratil (IFT) added as alternative investment; Sharpe ratios compared across all assets
- →Behavioural finance analysis: anchoring bias identified in GNE dividend yield anchoring
- →FinTech week: Python robo-advisor concept using yfinance for screeing ethical tickers at scale
// CHALLENGES
DDM produced a wildly high intrinsic value ($7.30 vs $2.33 market price) for GNE
Sensitivity analysis exposed extreme fragility (k−g spread of 2.4%); qualitative risk factors and behavioural bias analysis were used to discount the DDM signal
Small NZX universe made meaningful diversification difficult within the ethical mandate
Supplemented with ASX-listed NZ companies and IFT as a listed infrastructure proxy for private real assets
NZX50 futures hedge reduced upside disproportionately for a defensive, long-term position
Concluded the hedge was unsuitable given GNE's low beta (0.23) and the 35-year horizon; Sharpe ratio logic used to justify not hedging
AI-based FinTech tools conflict with the client's climate-conscious values
Proposed a deterministic Python screener using yfinance. auditable, low-cost, and zero AI compute footprint
03 / PROJECT
Inflation-Indexed Bond Pricing Model
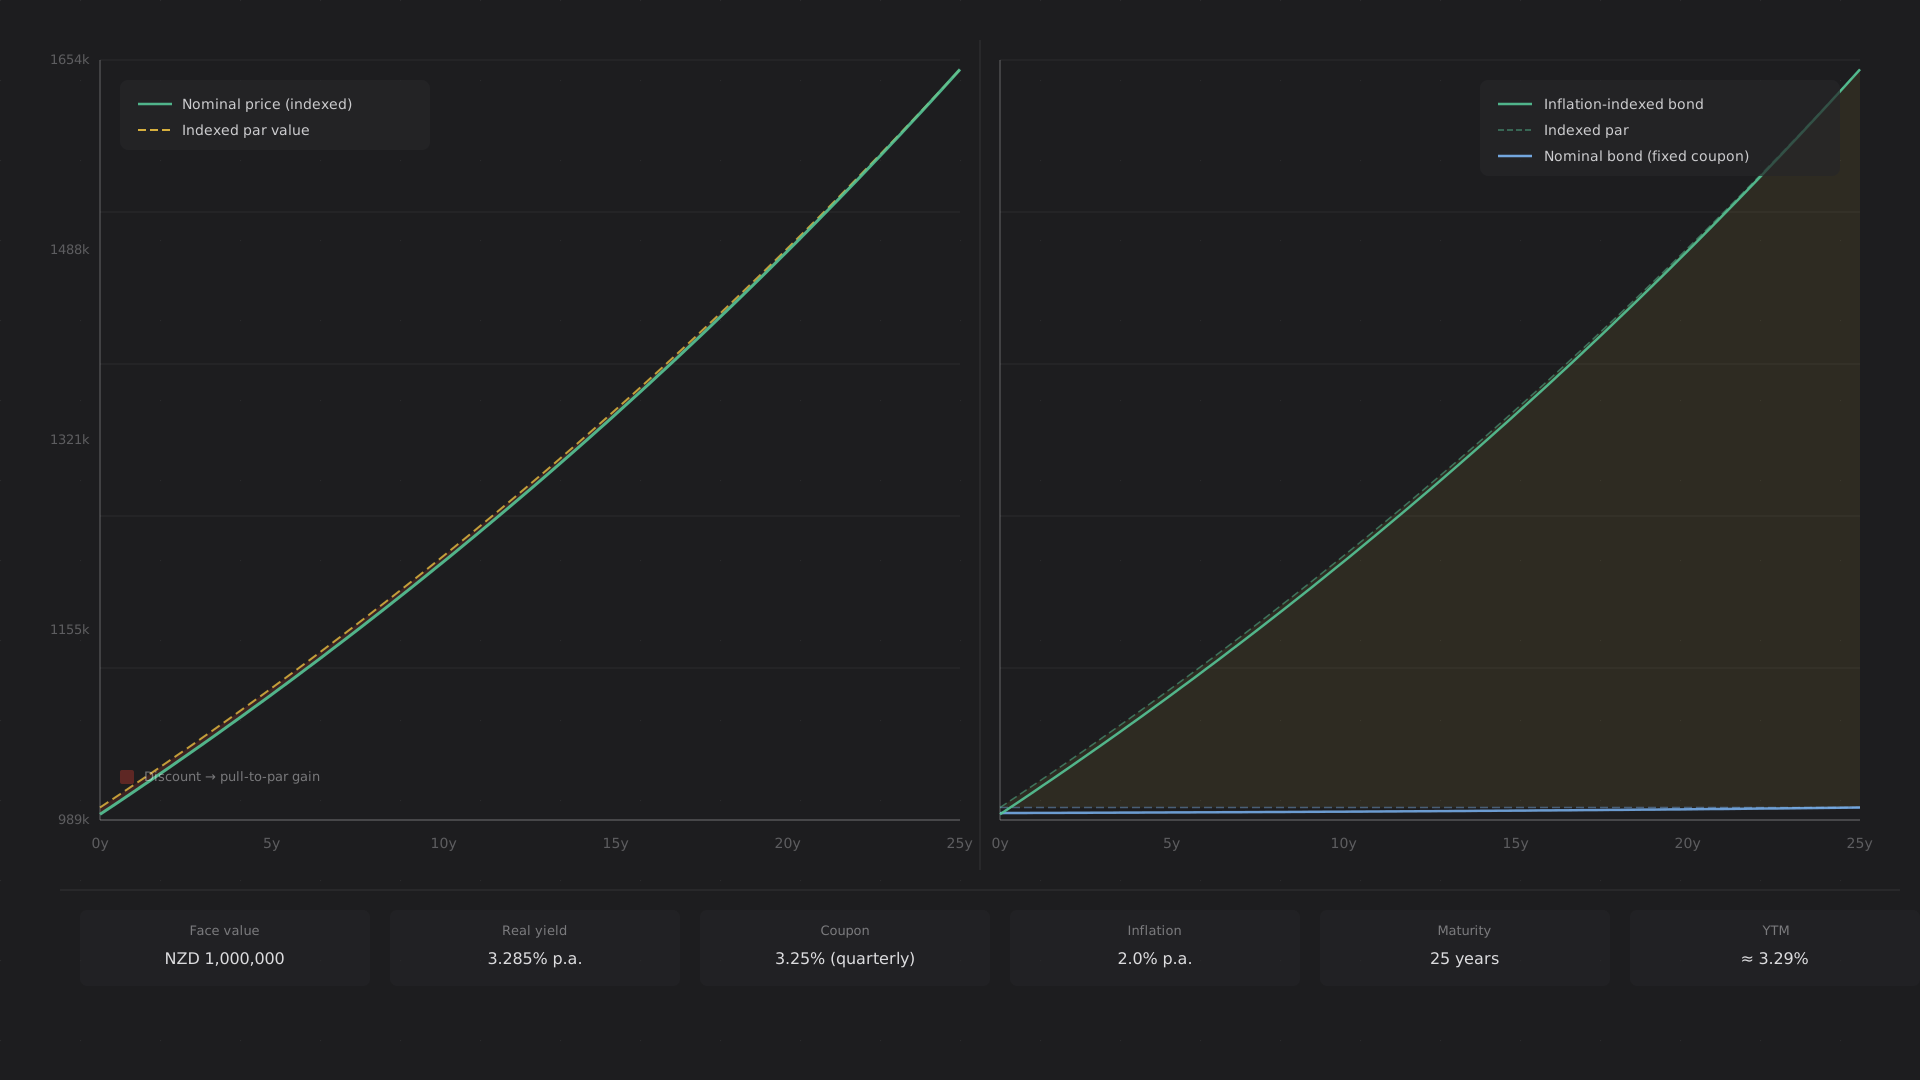
Python model visualising the pull-to-par mechanics of an inflation-indexed bond over 25 years, comparing real vs nominal pricing against a conventional fixed-coupon bond.
// FEATURES
- →Quarterly compounding model over 100 periods (25 years) for a $1,000,000 face-value bond
- →Inflation index computed as (1 + inflation)^t, applied to real cash flows to derive nominal price
- →Pull-to-indexed-par visualisation: nominal bond price converges to growing indexed par at maturity
- →Filled area chart highlighting the discount between bond price and indexed par over time
- →Side-by-side comparison of inflation-indexed bond vs conventional nominal bond pull-to-par paths
- →Separate difference plot confirming both bonds converge to zero discount at maturity
// CHALLENGES
Translating real cash flows into nominal prices across an inflation-adjusted timeline
Applied the CPI index multiplier I(t) = (1 + inflation)^t to the real PV at each period, cleanly separating real yield arithmetic from nominal price reporting
Demonstrating the structural difference between indexed and nominal bond behaviour
Parametrised both bond types with equivalent real/nominal yield spreads (3.285% real vs 5.285% nominal) so the comparison is economically meaningful, not just cosmetic